NVR web interface - Intelligent Analysis
Here you can review the results of AI alerts for specific events.
- Search
- Statistics
Search
This page lets you search for video of specific incidents. Customize your search using the filters.
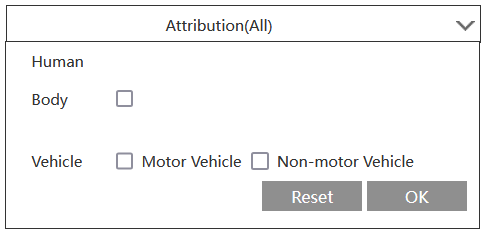
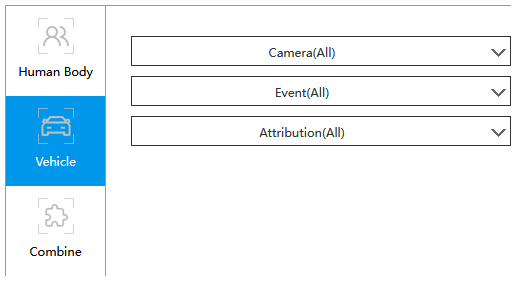
First select the target type in the left column: humans, vehicles, or a combination of both. If you choose "Vehicle" or "Combine", an additional dropdown appears at right that allows you to specify cars and/or non-motor vehicles.
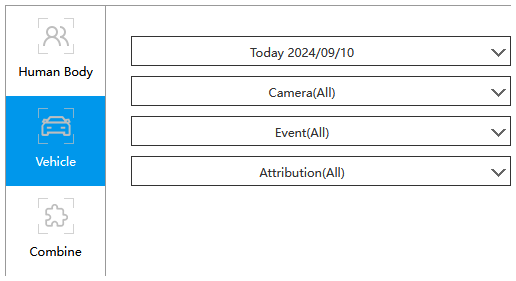
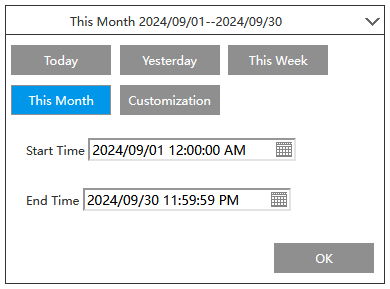
Select the date and time range to investigate.
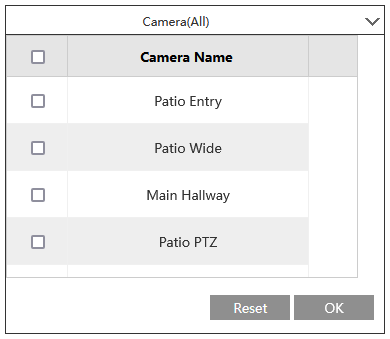
Select the camera(s) to include in the search.
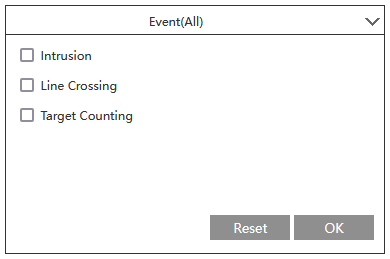
Select the type(s) of events to review.
If you chose the "Vehicle" or "Combine" filter, specify which type(s) of objects to look for.
Once you've closed all the dropdowns, click the Search button to display the results.
Search results display in the window at right. Select Picture or List to change how the results appear. Choose Snap to view the triggering object or Original Image to view the entire video frame. To the right, select whether to sort the list by Time or Camera. At the bottom are standard page controls if you have numerous results.
Click the star button (next to the Search button) and select “Add to favorite” to create and name a favorite group comprising the current search results. Later, you can view these pictures by clicking the star and choosing the group name.
Click a search result to play the associated video in the window at lower left.
Statistics
This page lets you view graphs of AI-reported incidents to identify trends.
First select the target type in the left column: humans, vehicles, or a combination of both. If you choose "Vehicle" or "Combine", an additional dropdown appears at right that allows you to specify cars and/or non-motor vehicles.
Select the camera(s) to include in the search.
Select the type(s) of events to review.
If you chose the "Vehicle" or "Combine" filter, specify which type(s) of objects to look for.
The graph displays in the window at right. Across the top, you can select the time period for the data. Graphs only use full-day data.
At the bottom right, click Export to save an Excel file (with the data charted) to your Downloads folder.